Roulette Prediction Calculator: What Spin History Can Show
This analyzer reviews a recorded spin history without pretending to know the next result. It measures number frequency, color balance, streaks and whole-wheel deviation, then separates descriptive patterns from evidence of a persistent physical bias.
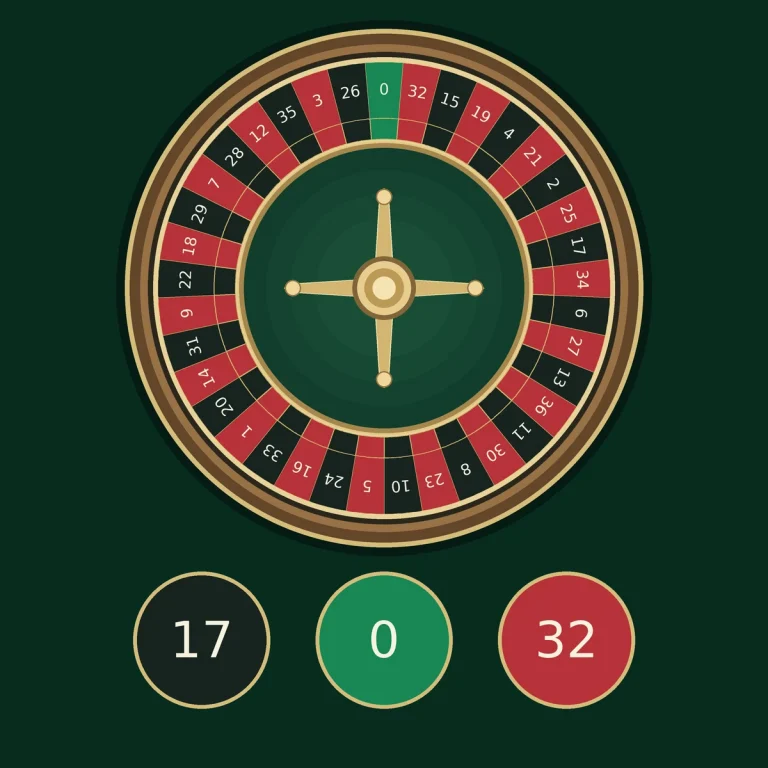
Can roulette prediction software predict the next number?
Software sold as a “roulette predictor” can refer to very different things. A spin-history analyzer can summarize frequencies and streaks after outcomes are known; a physical prediction system would need measurements from the current ball and wheel; and an RNG-prediction claim would require a demonstrated flaw in a specific software implementation. Those are separate technical problems.
This browser-based spin-history analyzer works with entered results. It can test recorded results, compare them with the fair-wheel baseline and flag samples that deserve further investigation. It does not turn past spins into a next-number forecast, and no download is required.
Roulette prediction software for spin-history analysis
Paste recorded outcomes in chronological order. Use oldest-to-newest order with commas, spaces, semicolons, vertical bars or line breaks, up to 10,000 spins. Invalid entries and longer lists must be corrected before analysis; outcomes are never silently removed.
Paste a sequence and run the analyzer. The result will describe the sample and state whether a whole-wheel goodness-of-fit test is meaningful.
| Observed count | Observed share | Expected count | Difference from expected |
|---|
| Group | Observed | Observed share | Theoretical share | Difference |
|---|
Roulette prediction formulas and algorithms: what they can calculate
A formula based only on completed spins can calculate descriptive or probabilistic quantities, but it does not create a new probability for the next fair independent spin. For a European wheel the baseline for one specified pocket remains 1/37; for an American wheel it remains 1/38.
Next-spin baseline for one pocket = 1 / number of wheel pockets Expected count in a history = sample size / number of wheel pockets Whole-wheel deviation screen = Σ (observed − expected)² / expectedAlgorithms can rank hot or cold numbers, identify runs and calculate deviation from the theoretical distribution. Those outputs describe the recorded sample. They should not be relabeled as an exact-number prediction unless a separate physical or software mechanism has actually been demonstrated.
How to interpret the roulette prediction calculator
This analyzer can answer a historical question: which outcomes appeared most often in this sample? It does not answer which outcome will appear next.
The whole-wheel chi-square statistic compares observed counts with equal theoretical pocket probabilities. The page reports a p-value only when the expected count reaches at least five per pocket: 185 spins for a 37-pocket wheel or 190 spins for a 38-pocket wheel.
A small p-value means the sample is unusual under the equal-pocket model. It can result from random variation, recording errors, mixed tables, changed equipment or a persistent physical bias. A fresh validation sample is needed before interpreting it as evidence; the roulette fairness guide explains which records can support a technical or regulatory claim.
Why recent results do not select the next number
On a fair independent European wheel, each pocket keeps a 1 in 37 baseline on every spin. On an American wheel, each pocket keeps a 1 in 38 baseline. The roulette odds calculator extends those fixed probabilities into exact hit counts, at-least-one-hit results and losing-run risk.
A number appearing repeatedly does not become less likely, and a missing number does not become more likely. The history changes the observed frequency table but not the independent next-spin model. The roulette wheel layout guide shows the pocket counts and physical number order behind that baseline.
This is why the tool displays the most frequent pocket and the unchanged next-spin baseline side by side. They describe different questions.
Try two histories with identical counts
Enter every European pocket from 0 to 36 once, then repeat that whole sequence five times. Each pocket appears five times: χ² = 0 and the reported p-value is 1.0000, even though the sequence is a deliberately ordered cycle.
Now group the same outcomes into five zeros, five ones, and so on through five 36s. The frequency table and p-value stay unchanged, while the longest repeated-pocket run rises from one to five and adjacent repeats rise from zero to 148.
Andrucci system: do hot numbers predict the next spin?
Andrucci is a number-selection approach: count recent outcomes, identify the most frequent pockets and place straight-up bets on those selections. Published descriptions differ on the observation window and stopping rules. For example, Roulette77's description uses 37 observation spins followed by betting until a hit. That is a described variant, not an established prediction model.
The analyzer above already ranks observed counts and reports ties. If several pockets share the lead, the history alone does not justify choosing one as a stronger forecast. Selecting more pockets raises both coverage and total stake.
A hit is not necessarily a profitable session
Consider a fixed set of k distinct pockets, with one unit staked on each on every wagering spin. Stop at the first hit, on spin t. Assume no earlier hits, no bets during observation and standard 35:1 straight-up settlement. The winning chip returns 36 units including its stake; all other chips lose.
Total staked = k × t units Session net at the first hit = 36 − k × t units- One pocket, first hit on spin 20: 20 units staked, 36 returned, net +16. Subtracting all 20 stakes from the 35-unit profit payout would count the winning stake twice.
- One pocket, later hit: spin 35 gives +1, spin 36 breaks even, and spin 37 gives −1.
- Three pockets: a first hit on spin 12 only breaks even; on spin 13 the session ends at −3.
- No hit within a 35-spin limit: one unit on one pocket per spin loses all 35 units. The losing session must remain in the record.
For one fixed pocket, the chance of at least one hit within 35 independent spins is 1 − (1 − 1/N)35: about 61.67% for N = 37 and 60.68% for N = 38. Neither is a guarantee. These figures assume every planned wager can be funded until a hit or the limit; they are not the probability of profit for every coverage or stopping rule.
How to evaluate a hot-number claim
- Define the rules first. Fix the observation window, number of selected pockets, tie-break rule, stake and stopping limits. Keep records from the same game and wheel where identifiable.
- Separate selection from validation. Choose numbers using the earlier sample, then record every later wager and outcome. Do not use the same spins to choose a leader and report its forecast accuracy.
- Count costs as well as hits. Record total stakes, gross returns and net profit, including unfinished or losing sessions. Retuning after seeing results requires another untouched validation sample.
Andrucci changes which numbers are selected; Martingale changes the stake after losses. Neither operation changes fair independent pocket probabilities. The payout calculator helps separate a winning bet's return from the result after all stakes are counted.
Can roulette be predicted with physics?
A physical roulette wheel is deterministic at the mechanical level. Small and Tse reported that measurements of initial position, velocity and acceleration could predict a landing region accurately enough to produce a positive expected return under controlled experimental conditions.
That result does not mean a list of previous winning numbers contains the required physical information. Their approach depended on measurements from the current spin, along with wheel geometry and the point where the ball leaves the track. This page does not collect those inputs or reproduce a live-wheel prediction system.
Mechanical prediction and historical pattern analysis are therefore separate problems. One uses current-spin physical measurements; the other examines past outcomes after the result is already known.
Wheel bias is not the same as a hot number
A physical bias means a persistent property of one wheel or setup changes the long-run distribution. Examples could include tilt, wear, rotor behavior or consistent operating conditions. Small and Tse noted that even a slight wheel tilt can systematically favor the region where the ball leaves the rim, making the mechanical problem easier to predict.
A hot number is only a descriptive label for a number that appeared frequently in a chosen sample. Random samples naturally produce leaders and streaks, even when every pocket has the same probability.
Bias screening therefore requires stable data collection from the same wheel, a sufficiently large sample and confirmation on new data. Selecting the most unusual result after examining many alternatives also increases the chance of a false signal. Fix the sample window and test in advance; repeatedly checking after every new spin or trying many windows does not preserve the nominal 5% false-alarm rate for the overall search. The roulette wheel-bias guide develops that process around wheel-specific records, predefined tests and mechanical inspection context.
AI roulette prediction and RNG software claims
RNG-based online roulette is not analyzed through ball speed, wheel tilt or dealer release patterns. The outcome is generated by software rather than inferred from a physical trajectory.
Standards such as UKGC RTS 7 and GLI-19 require applicable random outcomes to be unpredictable and follow the stated probabilities. These requirements are not proof that a particular operator or app complies. Testing laboratories assess RNG implementations for non-predictability, seeding behavior and outcome distribution.
- Record forecasts before the spin. Log every prediction, timestamp, selected pocket or coverage set, and result; keep misses as well as wins.
- Hold back fresh data. Choose the model and settings on earlier records, then evaluate on a later untouched sample from the same game. Retuning after seeing those results requires another validation sample.
- Use the correct benchmark. Predicting five distinct European pockets has a fair baseline of 5/37, about 13.51%, rather than 1/37. A hit rate alone does not account for stakes, payouts or losses.
A past-result list does not reveal an unknown RNG seed or algorithm. Claims that an app can infer the next online result from a short history should be treated as unsupported unless the operator's implementation has a separately demonstrated defect.
What the statistics do and do not prove
| Result | Supported interpretation | Unsupported interpretation |
|---|---|---|
| One number leads the sample | It appeared most often in the recorded history. | It is more likely on the next fair spin. |
| Long red or black streak | The sample contains a visible run. | The opposite color is now due. |
| Small chi-square p-value | The whole sample is unusual under the equal-pocket model. | The next winning number has been identified. |
| No significant deviation | The test did not detect a whole-wheel imbalance at the selected threshold. | The wheel has been proven perfectly fair. |
| Persistent anomaly in fresh data | The setup deserves controlled investigation. | A profitable betting method is guaranteed. |
Evidence and technical limits
Assessing a prediction claim requires separating three evidence standards: peer-reviewed physical-wheel research, regulatory requirements for random outcomes and laboratory RNG testing. None of them supports predicting a fair next spin from recent result history alone. The roulette session simulator provides a separate way to examine finite random samples without treating their temporary patterns as forecasts.
For game-format comparisons, see https://roulettecalc.com/casinos/. A table’s game rules and a recorded statistical pattern answer different questions.
This analyzer is educational. A pattern in historical results does not remove the house edge or guarantee a profitable next bet. Do not increase stakes because a number appears hot, cold, due or overdue.
Common questions about roulette prediction
Can a roulette prediction calculator know the next number?
No result-history calculator can know the next outcome of a fair independent wheel. It can summarize the past sample, calculate probabilities and screen for unusual distributions.
Does roulette prediction software work?
Software can legitimately analyze recorded outcomes, probabilities and statistical deviation. A claim that past spins alone reveal the next fair result needs separate evidence and is not supported by the independent-wheel model.
Is there a roulette prediction formula for the exact next number?
No formula built only from previous fair outcomes changes the next-spin probability of a specific pocket. Physical current-spin models and demonstrated implementation flaws are different cases because they use information beyond the finished result history.
Does a hot roulette number stay hot?
Not under the fair independent model. A hot number is simply a pocket with a high observed count in the selected history. Its next-spin baseline remains the same as every other pocket.
Does a long red streak make black more likely?
No. The next-spin probability is determined by the wheel layout, not by how many red or black results appeared immediately before it.
Can AI predict online roulette from previous spins?
Previous outcomes alone do not reveal the next result of a properly implemented unpredictable RNG. A valid claim would require evidence of a specific implementation flaw, not a generic machine-learning pattern.
How many spins are needed to test wheel bias?
There is no universal number that proves bias. This page waits until the expected count reaches five per pocket before reporting the whole-wheel chi-square p-value, but that is only a screening threshold. Confirmation requires a larger controlled sample and fresh validation data.
Was this tool helpful?
What went wrong?
For calculation problems, inputs and results are attached to your report.